
In a previous blog post, Getting the most from metrics, I suggested using the acronym METRICS in order to show what metrics could, or probably should be, in order to ensure that you are getting maximum value from them. Last time I took a look at Meaningful Metrics. In this post I consider ‘Evolving Metrics’.
Metrics can evolve in a number of ways. Firstly, metrics will change throughout the course of an Agile delivery. Figures/percentages will go up and down and the analysis of these fluctuations allows for inferences to be drawn, recommendations to be made, changes to be implemented and and the impact of these to be seen in the production of future metrics.
Using the example in Meaningful Metrics, Team Alpha saw an increase in the number if user stories completed each month, until Month 4 when there was a fall in the number of user stories completed. Similarly, the number of story points delivered for those user stories also fluctuated, with Month 4 having the highest average story point size. With fewer user stories being completed and with the number of story points for those user stories being higher, it could suggest that those user stories were more time consuming, more complex or contained greater risk.
Fluctuations in metrics will occur naturally, and keeping a log of key events, team holidays and/or impediments may help in confirming the reasons for change. The use of a timeline retrospective will allow the team to identify and share their thoughts on the reasons for these changes. There will also be periods where it is known that metrics will differ, for example, summer and Christmas periods are generally less productive as team members take annual leave.
Another way that metrics can evolve is through the creation of a new metric. Although you may produce a number of metrics on a regular basis, it may be necessary to create a new metric in order to understand the effect of a change or impediment. A former Scrum Master colleague of mine did just this when his team fed back in a Sprint Retrospective that they were attending too many meetings and this was preventing them from focusing on developing, testing and getting user stories to done.
In order to get an initial view of the value that his team were getting from each of the meetings that they attending, my colleague put a number of poker chips on his desk in three colours. For each meeting his team attended they had to collect a poker chip to show if it added value, there was neutral value, or if the meeting had no value. At the next Sprint Retrospective the team were able to collate their poker chips and identify anecdotally if there was value in the meetings that they were attending.

Of course, this would just be the start of this metric. Further analysis would be required in order to determine the types of meeting where the team thought that value was being added and those where value was not. It would also be necessary to cross-reference the teams thoughts to see if everyone had the same opinion of each meeting and understand what was happening in the meeting if some people thought they were valuable, while others did not. Other factors such as the length, location, agenda and facilitation of meeting could all play a part in their success and would need to be considered in the next phase. As noted in ‘Meaning’, you cannot rely on just one metric, additional data is required to provide context to the results.
Another way metrics can evolve is to change the variable that is being analysed in order to provide a different perspective. In a previous role, I regularly produced a phased cycle time graph that considered the average time that each user story spent within each state on our Kanban board. Each bar on the chart represented a month and it was possible compare the current and previous months. An example of this graph is below.
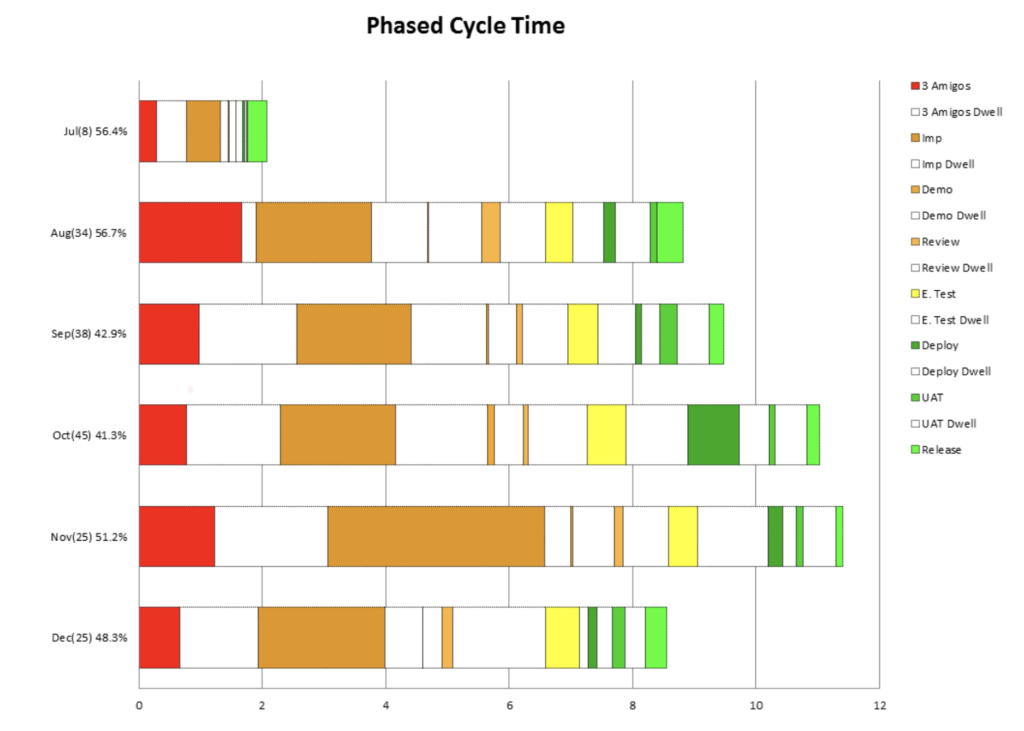
The analysis of this type of graph allowed for inferences to be drawn and discussed at Sprint Retrospectives during a metrics review. Following one such session my team decided to undertaken an experiment and combine columns on the board to see if that would improve the average cycle time – see Together we are, The Three Amigo’s for further details.
Towards the end of a delivery I decided to undertaken some ad hoc analysis. This involved producing similar phased cycle time graphs to the one above. Instead of comparing the data month-on-month, I wanted to consider the phase cycle time of different variables, namely investment theme (class of service) and story point size. I wanted to understand if the different categories or work resulted in shorter or longer cycle times. Similarly, I wanted to understand if there was a correlation between story point size and the length of time it took to develop and/or test and/or release a user story to live.
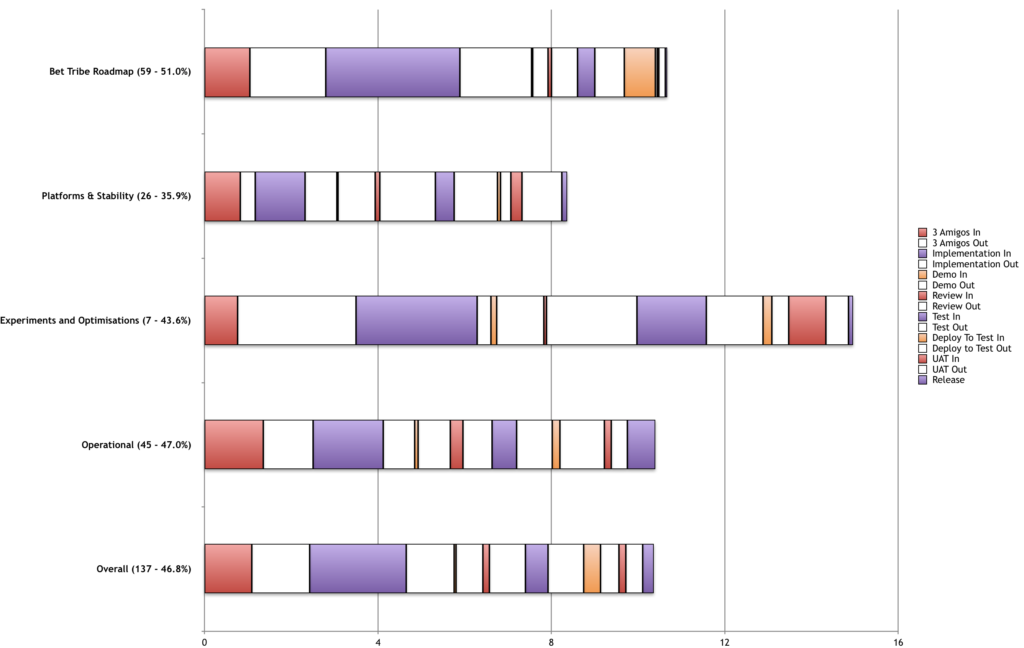
The first chart shows phased cycle time by investment theme. Our user stories fitted into four classes of service:-
- Roadmap – this was our main focus of delivery with approximately 70% of our time being spent in this area
- Platforms and Stability – this theme looked to improve the underlying infrastructure as well as addressing live incidents
- Experiments and Optimisations – this theme allowed the running of small experiments or optimisation to see if further development should be conducted in that area
- Operational – this theme considered business as usual enhancements
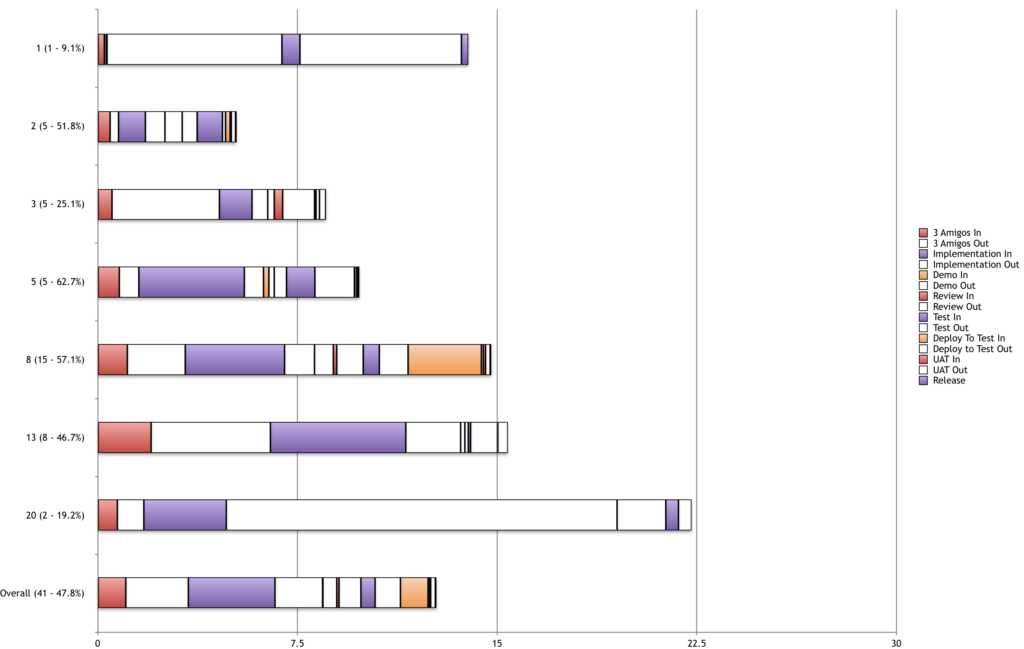
The second chart shows phased cycle time by story point size.
These charts highlighted some points of interest that allowed for further discussion within the team. One particular point that was noted was that there average development time of 5, 8 and 13 point stories was similar. What differed was there amount of time the user story took to pass through the 3 Amigo’s and then the amount of time it the took for the user story to be picked up for development. Even though the team collaborated during the 3 Amigo’s process to create a shared understanding of the user story, the team confirmed that they were reluctant to pick up user stories with larger story point sizes due to the perception that they would take longer to develop and/or they were more complex. It was then agreed that any user story that was sized above 8 story points should look to be broken down into multiple stories that could be delivered independently.
One further way in which metrics can evolve is how they are presented. Presenting the same data in a different way can suggest alternative reasons or solutions to what is being seen.
In order to product the above phased cycle time charts, I extracted data from JIRA on the amount of time each user story spent within each state of the workflow. There were no restriction on the workflow on the JIRA board used by the team, allowing for user stories to be moved directly to their correct state. During the manipulation of data and the production of the above charts, I noticed that there were some states that saw little use.
The column in question was a demonstration column following development and prior to code review. I knew that demonstrations of developed code were taking place within the team as I had seen them occurring. I produced a table to show the regularity of the columns being used and asked the team if they had any suggestions that would solve this problem.
One solution would have been to mandate in JIRA that each user story flowed through each state. Although this would increase the use of each column to 100%, this could be seen as gaming the system. If a user story was not updated in JIRA in a timely manner, it is likely that multiple state moves would occur within a few seconds of each other. This would make further analysis of the workflow more difficult and time consuming. The solution adopted by the team was to combine columns. As the demonstration of the developed code took place a the end of development, it was suggested that the demonstration be included in the definition of done for the development out column.
All metrics should be evolving and understanding the reasons behind their evolution is key to being able to inspection and adaption and understanding if the changes you implement have a positive or negative effect.
I challenge you to review your metrics and identify how they are ‘evolving’.