
It’s time for another entry in my series of blog posts exploring the acronym METRICS, idenitfying what metrics could, or probably should be to ensure that you are getting maximum value from them. I have previously taken a look at:-
Today, it is time for me to look at ‘Imaginative Metrics’.
To many people the thought of metrics does not excite them. In fact it may even scare them, thinking that they are the ones being measured. This should not be the case. Used and presented in the right way, metrics can be an extremely useful and valuable tool for any delivery team.
Metrics can be used by a delivery team to:-
- Radiate progress towards a Sprint/delivery goal
- Forecast a potential delivery date/window
- Predict future trends
- Identify areas that could be improved
- Monitor experiments
There are a number of metrics that most teams will be aware of, with burndown and burn-up charts being some of the most common metrics in use. These are likely to be closely followed by cumulative flow diagrams, control charts and cycle/lead time graphs. And this is just the beginning. Once you start looking at creating metrics, the sourcing and analysing of raw data can lead you from one metric into the creation of another. This is one way that you can start to be imaginative, through the combination of, and/or creation of metrics in order to help highlight, understand and/or solve a problem.
As well as producing metrics regularly for my team, I’m currently part of two groups that are looking at metrics across our programme of work. Through the conversations and investigations that are taking place, I have provided suggestions as to how we could create and learn from different metrics. One such metrics looked at the accuracy of the team – how good were we at estimating the number of story points taken into a Sprint?
Initially I produced a graph that only looked at accuracy, but this left me asking why some Sprint were more accurate that others? Could the number of story points that we forecasted for delivery affect our accuracy? Through the collation/calculation of more data, I was able to start to get value from the metric. I produced a chart similar to the one below.
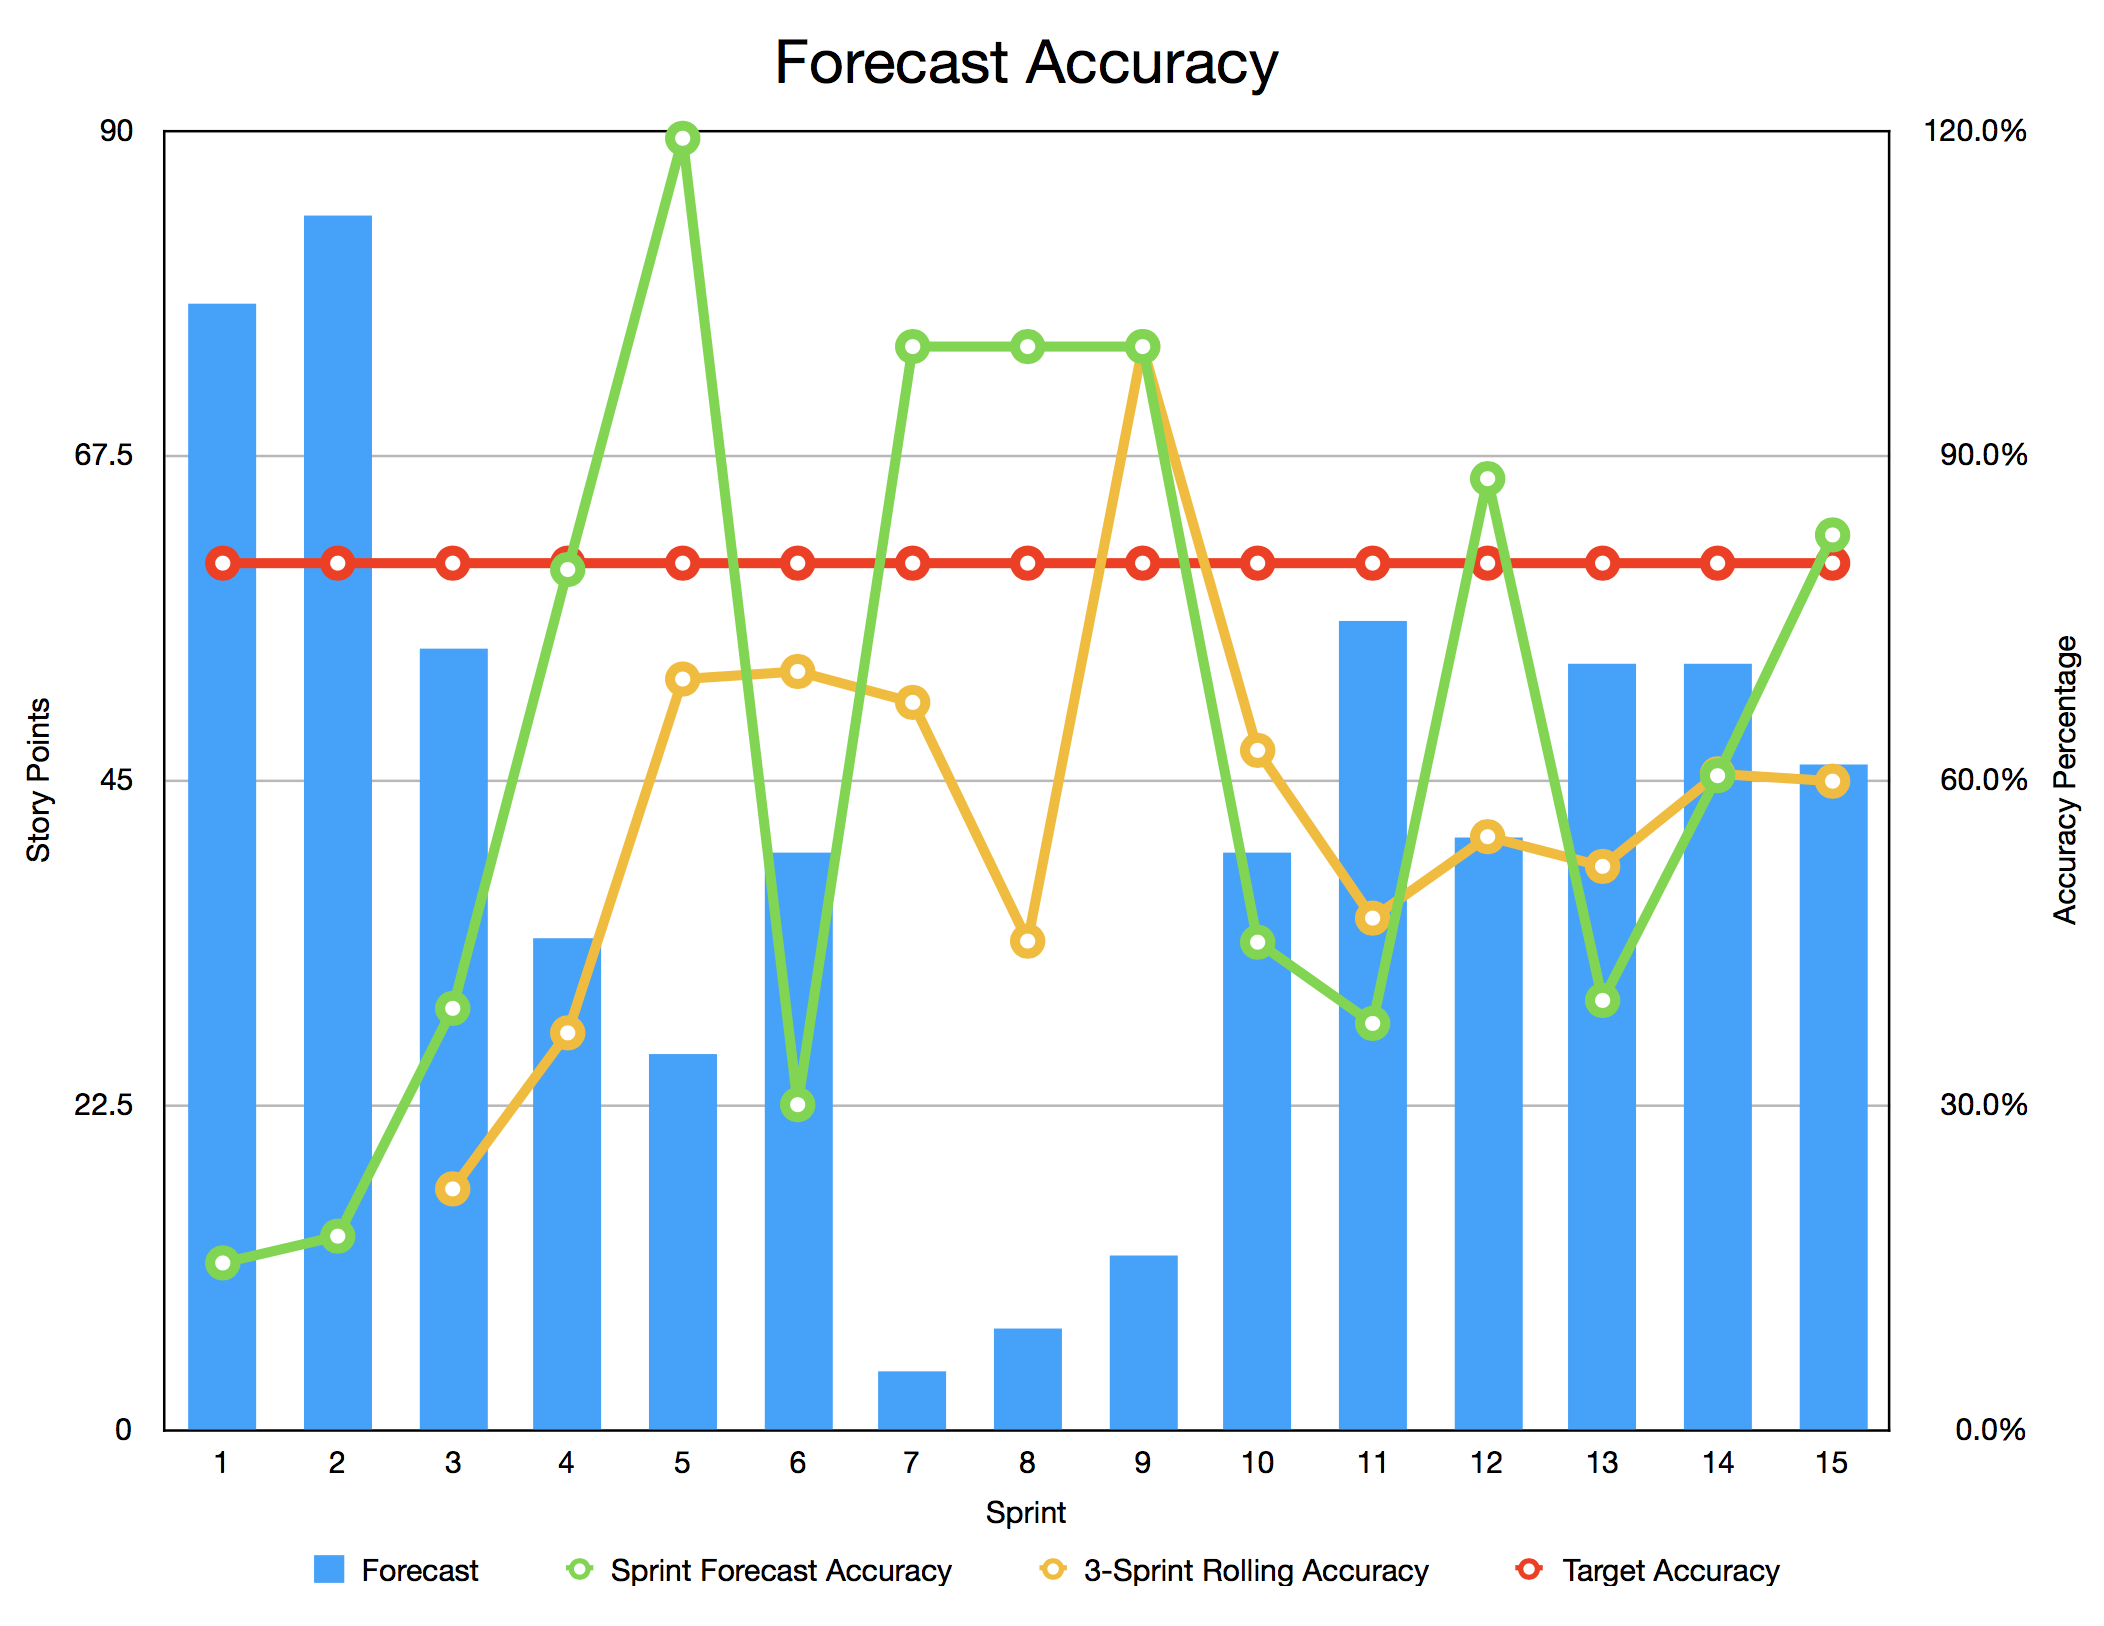
This chart enabled me to articulate a number of things to the delivery team and to management. Firstly, it shows that we are not very accurate in our forecasts and therefore, as a team, we are not very predictable. This is an area that I will need to work with the team need to improve. An accurate/predictable team will be able to build a better relationship with the management team enabling forecasted delivery windows to be trusted. It also shows that, when we took less story points into a Sprint, we were more likely to achieve our forecast. However, the chart also highlights Sprints where numbers are likely to have been ‘gamed’. There were three Sprint in a row where we achieved 100% accuracy, however, the number of story points forecasted was extremely low. This is not something at all that I condone, but was forced upon the team by a management decision. Production of this chart provides me with evidence that I can use to coach the management team/organisation as to why such decisions are not good for them, or the team.
Sometimes the production of the same old graph or chart can be boring. Interest in it can stagnate and its value diminishes. One example of this can be the Sprint Burndown chart. At the beginning of each Sprint the chart will have an average line that runs from the number of points that you have in the Sprint at the start, tailing off to zero on the final day of the Sprint. The issue with this graph is that it expects a continual delivery of story points for you to stay on the average line. However, as story points can only be claimed when a user story reaches a definition of done, the graph will be ‘stepped’. Due to the time it takes to develop and test user stories within a Sprint, you are always likely to be ‘behind the curve’, so why not change it?
There are a number of potential options. Why not make the average line stepped and/or estimate when the first user story(ies) will be delivered? If the first user stories are not generally delivered until day 2 or 3 of the Sprint, have the average line (or step) start a couple of days into the Sprint. The angle of the line (or step height) will increase, but may provide a more realistic/likely delivery timescale/estimate.
Another option to keep metrics imaginative is to change where the metrics are displayed. I have metrics recorded in JIRA and on Confluence. I also have hard copies of our charts on a team wall, which I call out ‘information radiator and transparency wall’. Why not display the metrics in an alternative location? How about next to the tea/coffee making facilities, or, even in toilet cubicles? That would certainly get them noticed!
As well as changing where the metrics are displayed, why not change the type of graph being used. If you are using Excel for the production of your metrics, there are a variety of graphs (column, bar, line, pie, area, scatter doughnut, bubble etc.) that you could use. Mixing it up may show you something unexpected.
In the blog post ‘Evolving Metrics’ I mentioned an example of using poker chips to measure meeting effectiveness. In the Scrum Master Toolbox podcast from 7th June Vasco Duarte talks about how one team he worked with was overwhelmed with work. They used balloons to visualise each task they were given, and when they were given another task they would blow up another ballon. Very soon the floor was full of balloons. When someone came to the team to ask them to undertake another task, they were able to very quickly share how much work they had on.
These alternative ways of measurement are fun, visual and will keep the delivery team engaged. Furthermore, if you fill your office with balloons, it will become obvious how much work you have on your plate and why it may be taking so long to deliver.
My challenge to you is to think how to make you metrics more imaginative. If you have any other ideas for imaginative metrics, I would love to hear about them. Please leave me a comment below.